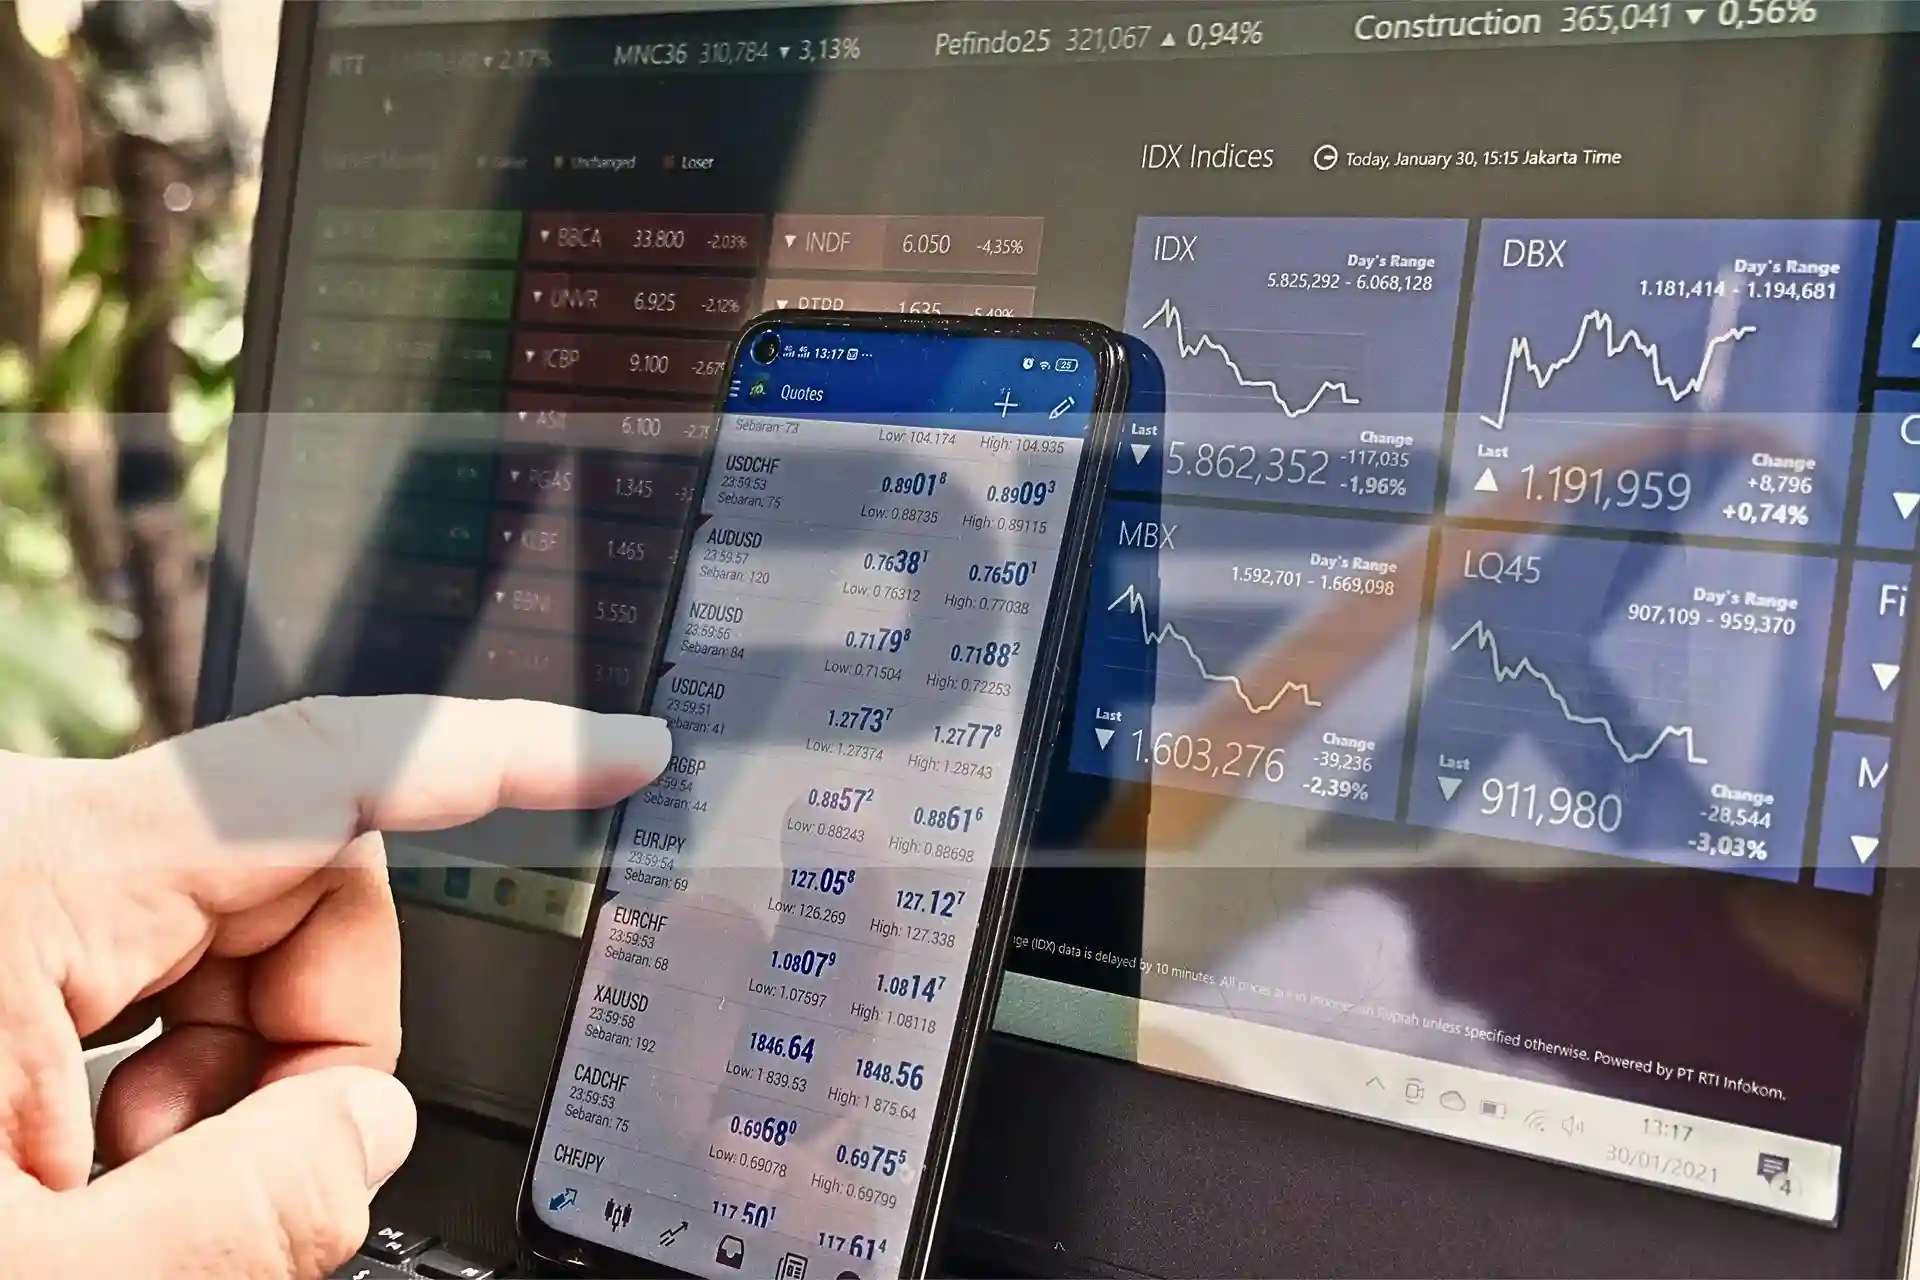
Trading within financial markets is a mix of art and science. Of all the tools traders use in their day-to-day activities, technical analysis is one of the best-reputed ways for a trader to make an informed decision. This blog will discuss the very foundation of technical analysis for trading, the essential tools, and how you weave those elements together effectively into a cohesive trading strategy.
What Is Technical Analysis?
Technical analysis is a method for determining and projecting future price movements with respect to an asset’s past price data, volume, and other market statistics. It forms an investment process in contrast to the various kinds of fundamental analysis, which concern a company’s financial health, economic factors, and general macroeconomic situations.
Technical analysis assumes that an asset’s price already includes everything relevant. This further leads to the understanding that a trader studies market price movements to recognize chart patterns in trading that would forecast future conduct.
Critical Principles of Technical Analysis
Market Discounting: This principle points out that all available information will already be duly priced within an asset, and the price will move to reflect that value.
Price Moves in Trends: The technical analyst believes that prices move in trends, and once a trend is established, it tends to continue until it reverses.
History Tends to Repeat Itself: Any entity’s historical price movements tend to repeat over time. Past price behaviour is studied to understand where similar market reactions may go.
Basic Tools and Indicators
Technical analysis encompasses an extremely rich set of tools and indicators that help traders identify trends, including:
Charts
- Line Charts: These represent the simplest charts, only showing the closing price.
- Bar Charts: This chart shows open, high, low, and close prices for each period.
- Candlestick Charts: These charts are similar to bar charts but with a better visualization display that enhances pattern detection.
Support and Resistance Levels
- Support: The price level at which a downtrend is expected to pause due to the concentration of demand.
- Resistance: A price level at which a trend is likely to pause or reverse itself due to a concentration of selling pressure.
Moving Averages
- Simple Moving Average: It averages security prices over the chosen period.
- Exponential Moving Average: Weighting recent prices in this way makes the moving average more responsive to new information.
Relative Strength Index
It is a momentum oscillator that calculates the velocity and change of price movements. The RSI moves on a scale from 0 to 100, and readings above 70 indicate an overbought security, while those below 30 indicate an oversold security.
Bollinger Bands
It is made up of a moving average with two standard deviation lines, one above and one below. Bollinger Bands are used to find out if prices are high or low with respect to previous recorded prices.
MACD (Moving Average Convergence Divergence)
A trend-following momentum indicator that makes visible the relationship of two moving averages. The MACD is calculated by reducing the 26-period EMA from the 12-period EMA.
Volume Indicators
The volume indicators are the tools that help us interpret the strength of trends using volumetric data.
Creating a Trading Strategy Using Technical Analysis
A trading strategy created through technical analysis combines various tools and indicators and brings forth a systemic way of trading. Here’s a step-by-step for you to build your strategy:
Identify Your Trading Goals and Style
Whether you’re a day trader, swing trader, or long-term investor, you need to know who you are. Your trading style will drive the timeframes and types of analysis you use.
Select the Proper Market
First, decide on a market to trade: equities, forex or commodities. As known, each of these markets has different characteristics, and your choice will then dictate what tools and indicators are most appropriate.
Select Your Tools and Indicators
The technical tools and indicators will depend on the trading style or market. A day trader may focus on moving averages and RSI in the short term, while a long-term investor might use trend lines and MACD.
Looking Into Market Trends:
Use charts to identify the prevailing trend of the market. Are you in a bull market, a bear market, or a sideways market? Knowing the trend is very critical as it advises your decisions on trading.
Determine Entry and Exit Points
Identify entry and exit points based on your selected indicators. For instance, you can open a trade when the price exceeds a moving average and close the trade when RSI flashes an overbought condition.
Set Stop-Loss and Take-Profit Levels
You will need to implement risk management strategies. Put up stop-loss orders to prevent potential losses and take profit levels to lock in your profit. These can be based on support and resistance, ATR, or even fixed percentages.
Backtest Your Strategy
Always backtest your stock market strategy using historical data before you trade with it in the live market. This will let you know how it works in different markets and thus help you fine-tune your strategy.
Monitor and Adjust Your Strategy
Markets are dynamic, and no strategy works forever. Continuously monitor your strategy’s performance and adjust based on changing market conditions or new insights.
Common Pitfalls and How to Avoid Them
While technical analysis can be a great tool, it has its pitfalls. Here are some common mistakes traders make and how to avoid them:
Overcomplicating the Strategy
Using too many indicators can result in conflicting signals and analysis paralysis. Just use a few key indicators that match your strategy.
Ignoring Market Sentiment
One should also combine technical analysis with the knowledge of market sentiments. News events, economic data releases and geopolitical developments can move markets.
Chasing the Market
It is human nature to get greedy to be a part of the market action by entering into trades impulsively after short-term price movements. Stay disciplined; follow your strategy patiently and wait for the proper setup conditions
Failing to Manage Risk
None of the strategies is perfect. Always put stop-loss orders and never risk more than a small per cent of your trading capital on one trade.
Failing to Review and Refine
Review your trades and strategy performance from time to time. Learn from your mistakes and continuously refine your approach using candlestick analysis techniques.
The Bottom Line
Technical analysis is thus an important tool that helps traders get acquainted with market trends and make proper decisions. You can improve your trading performance by grasping and following the principles, tools, and strategies. It is, however, paramount to understand that technical analysis does not guarantee profits. You can wade through many of the complexities in the financial market by combining sound risk management and discipline with continuous learning.


